CREAM Performance Tests
EGEE-III-SA3-TEC--CREAMPerfReport-v1-0
Copyright © 2009 GRNET
Abstract
A test scenario for CREAM is described wherein the queue size is
required to be sustained at 5000 queued jobs. Some indicative
results from running the test on our site, EGEE-SEE-CERT, are presented along with the
performance issues that were raised. Additionally we briefly
mention two extra stress tests conducted in order to investigate
newly found performance issues. In all, the tests conducted are
directly related with the acceptance criteria for the transition to
CREAM. Specifically we have found that the criterion for 5000
sustained queued jobs is satisfied.
Table of Contents
Introduction
In this document we will describe the performance testing of CREAM and reach some conclusions regarding the acceptance criteria, for the transition to CREAM, in particular regarding the criterion "J", i.e. 5000 jobs sustained in the queue. The impatient reader may refer to the section called “acceptance criteria for the transition to CREAM” for the coverage the tests provided with regard to the transition criteria and also the relevant conclusions.
Main Test Scenario Specification
Requirement of sustained 5000 job queue size
This test is meant to assert the fact that CREAM satisfies the requirement of handling 5000 jobs sustained in the queue.
Assumptions
In this test we assume that we are trying to simulate a relatively big Tier 1 site with 500 job slots in total. About 5000 jobs will be queued at any time and new jobs should be submitted at a reasonable rate. Every so often a new user will attempt to access the site. A number of jobs must be monitored at a specific rate for their completion and purged when they are finished.
Test Method
In order to simulate 500 job slots we will use "sleep" jobs so that our worker nodes can be configured with many more slots than would be normal for their potential, i.e. the number of their processor cores. For example if we have 5 worker nodes they can be configured to have 100 job slots each, thereby achieving 500 jobs slots for the whole site.
Job submission, status requests and purging will be performed using pre-delegated proxies and the arrival of new users will be simulated by the delegation of a new proxy. Also job status requests and job purging will be simulated by polling for the status of some jobs and then purging those found to be in DONE or ABORTED state.
Technical Description of the Test
Submission Strategy
The tests consist of two phases, the ramp-up phase and the sustained phase. In all cases the same JDL will be used, see Appendix B, 60-minute JDL for more information.
Job Ramp-up Phase
Initially we have 5 processes submit 500 60-minute jobs each from a UI, using 5 different delegated proxy ID's. Each process submits jobs sequentially as fast as it can [1].
Sustaining phase
Once the ramp-up phase is complete we have roughly 5000 jobs queued jobs[2]. Next, in this phase we submit jobs, using a single delegated proxy ID, in order to sustain the current level of queued jobs. The submission rate should theoretically be equal to the job duration divided by the number of slots available. The result in our case, 6 seconds per job, is a theoretical number because the amount of overhead might cause some divergence. In practice it will be necessary to adjust the rate periodically.
Along with the process that sustains the queue size, two other processes are needed, one to delegate new proxies (simulating new users) and one to monitor selected jobs and purge them. New proxies will be delegated every 2 minutes, while every one minute 5 jobs will be monitored for status changes and will be purged upon completion.
This phase should last at least a couple of days, in order for it to bring to bear possible problems related to scale and duration. Due to the long duration of the test the proxy ID used for submission must necessarily be renewed. Due to the architecture of CREAM this can be very costly when a single delegated ID is used [3] so it should happen as infrequently as possible, i.e. every 12 hours.
Site configuration
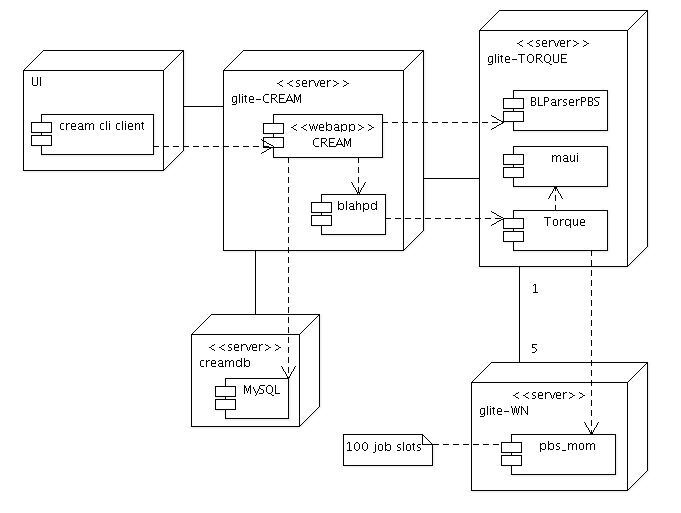
The site that is used for performing the tests is EGEE_SEE_CERT. The computing element used is,
of course, CREAM but without the creamdb deployed on the same node. It is located
on a separate machine, running only the MySQL server. See Figure 1,
“Deployment of test critical components” for a graphic
representation. The software versions are those currently in
production with the exception of specific certified or
preproduction patches that were applied to the CREAM and PBS nodes
for various reasons (see Appendix A, Installed
patches for details). An overview of the hardware and
software configuration of the relevant nodes appears in Table 1,
“EGEE-SEE-CERT site configuration”.
The gLite components installed on the site are deployed in the default manner.
Caveat
Due to some problems observed during the execution of the tests the following exceptions apply to the configuration of the site:
- the maximum open file descriptors on the CREAM node are increased relative to the default value, due to a problem with tomcat file descriptors.
- We addressed the issue regarding the optimization of the extra_attribute table in creamdb by adding an index on the jobID column.
- In
maui.confthe value ofRESDEPTHwas increased to 200 in order to avoid a problem with maui reservations. - The torque
server configuration was modified by setting
mail_domaintoNeverandmom_job_synctotruedue to some performance issues related to torque.
Test Data Collection
Test data is recorded in two ways: first, CREAM itself logs very detailed information on job state transitions in the creamdb. Additionally custom scripts and vmstat are run on the relevant nodes to collect performance data.
At the end of the test we are able to run SQL queries against the creamdb and analyze the test progress at each moment. See Appendix C, Useful SQL queries for more information on these queries.
The custom scripts, which are reproduced in Appendix D, Monitoring scripts, are run periodically every minute on each node, using cron. When run, the scripts output a single line, containing a timestamp and information about the state of the system (load average and number of processes) and information related to specific processes. See Table 2, “Processes monitored by scripts” about which processes are monitored on each node:
Table 2. Processes monitored by scripts
| Node | Processes | Data collected |
|---|---|---|
| MySQL | mysqld | cpu |
| size | ||
| system | cpu | |
| CREAM | Tomcat (java vm) | cpu |
| size | ||
| open file descriptors | ||
| BLAHPD (multiple processes) | cpu | |
| average process size | ||
| biggest process size | ||
| system | cpu | |
| PBS/Torque | pbs_server | cpu |
| size | ||
| running jobs | ||
| done jobs | ||
| other jobs | ||
| open file descriptors | ||
| maui | cpu | |
| size | ||
| open file descriptors | ||
| BLParserPBS | cpu | |
| size | ||
| system | cpu |
Presentation of Test Results
The test described in the previous sections was repeatedly run on our site and results were reproduced generally without major differences.
In this section we will highlight the interesting parts of one specific test run, which ran for about 4 days. In total 52685 jobs were submitted to CREAM. Upon conclusion of the test we examined the database of CREAM to get a view of the status of the jobs.
Number of jobs and failure rate
As can be seen in Table 3, “Job status'”, only 1 job was not succesfully completed, out of a total 52685, so the failure rate was approximately 0.01%.
Table 3. Job status'
| Status | Number |
|---|---|
| ABORTED | 1 |
| DONE_OK | 52684 |
See Appendix C, Useful SQL queries for the query that produced these results.
The one exception was a job in ABORTED state with the following failureReason:
BLAH error: submission command failed (exit code =
                 201) (stdout:) (stderr:[gLExec]:   gLExec has detected an
                 input file change during the use of the file. It's unknown if
                 this file-jacking was accidental or intentional.-) N/A (jobId
                 = CREAM089615287)
Performance
CREAM was found to be able to handle a sustained queue size of 5000 jobs, after addressing the issue with the optimization of the extra_attribute table. In practice, during the tests, the queue size fluctuated to some degree due to various unpredictable factors, e.g. the submission overhead, but was maintained above 5000 jobs.
Figure 2, “Queued jobs and CREAM CPU usage” depicts the most important performance measurements on the CREAM node during a representative time period. The queue size is on the rise because the submission rate is slightly faster than what the system can handle.
Figure 2. Queued jobs and CREAM CPU usage
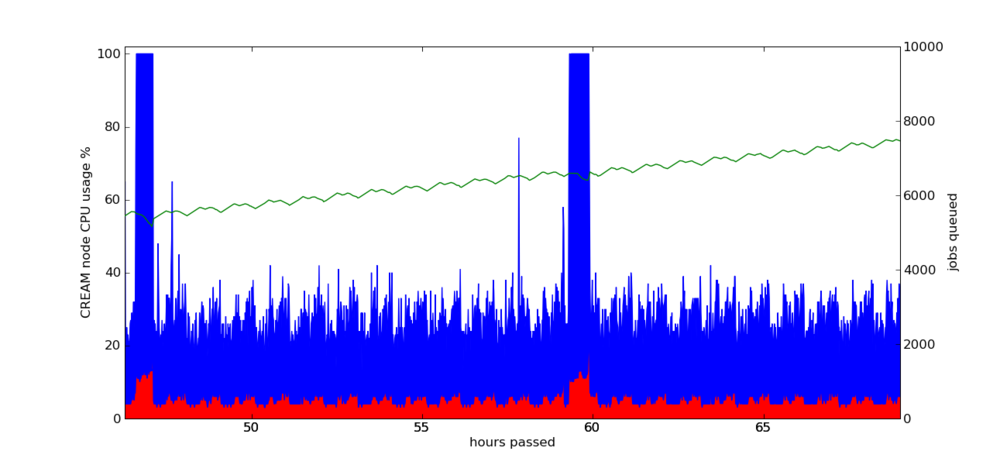
As can be clearly seen from Figure 2, “Queued jobs and CREAM CPU usage” a performance issue exists in the form of 100% cpu usage spikes every 12 hours. These spikes are due to the issue with proxy renewal. Apart from these spikes CREAM is handling more than 5000 jobs with relative ease.
CREAM DB performance
During the evolution of this test it became evident that the cream database performance is critical to the performance of the service. Initial tests resulted sometimes in the mysqld daemon reaching extremely high cpu usage rates After resolving some of the issues described in the section called “Resolved Issues” things got better, but some problems remain. By monitoring the database for slow and frequent queries we were able to discover some of these.
Figure 3. MySQL CPU usage
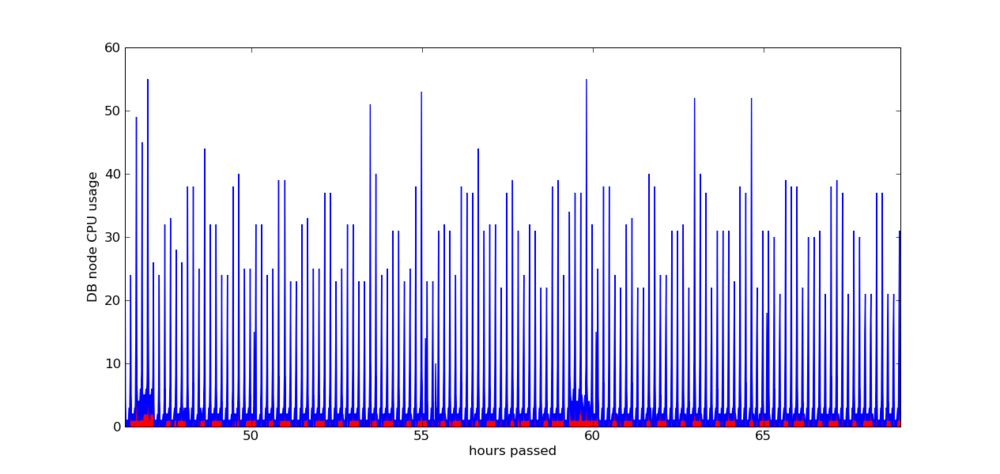
As can be seen in Figure 3, “MySQL CPU usage” the cpu usage appears as spikes of various magnitudes, at mostly regular intervals. Specifically there are spikes at 10 minute intervals and also every 5 hours. Using the MySQL option to log slow queries we were able to identify the slow queries that cause the spikes.
Specifically, every 10 minutes the performance of MySQL is hit by queries similar to the one in Example 1, “Current job status query”.
Example 1. Current job status query
SELECT count(*) AS COUNT_JOB
   FROM job, job_status
   WHERE true
      AND job_status.type IN ('1')
      AND job_status.jobId = job.id
      AND job_status.id = (
         SELECT MAX(job_status.id)
            FROM job_status
               WHERE job_status.jobId = job.id)
In Example 1,
“Current job status query” the number of jobs with a status of
1 is calculated; CREAM makes the same
type of query for status other than 1 as well. There is much room
for improvement if the use of sub-selects is avoided like in
Example 2,
“Rewritten job status query”.
Example 2. Rewritten job status query
SELECT count(*) AS COUNT_JOB
   FROM job_status AS status
      LEFT OUTER JOIN job_status AS latest
         ON latest.jobId=status.jobId
           AND status.id < latest.id
   WHERE latest.id IS null
      AND status.type IN ('1')
On our hardware, the query in Example 2,
“Rewritten job status query” is nearly 4 times faster than the
one in Example 1,
“Current job status query”.
Similarly the following type of query, which seems to be performed every 5 hours, impacts the performance of the MySQL considerably, although not as much as the one in Example 1, “Current job status query”.
SELECT job.id AS id
   FROM job, job_status
   WHERE true
     AND time_stamp <= '2009-07-08 02:17:13.568'
     AND job_status.type IN ( '0')
     AND job_status.jobId = job.id
     AND job_status.id = (
        SELECT max(job_status.id)
           FROM job_status
           WHERE job_status.jobId = job.id)
This query could also be re-written without sub-selects.
Last, although it did not occur during the period depicted in Figure 3, “MySQL CPU usage”, the following type of query has been found to severly impact CREAM performance:
SELECT commandId
   FROM JOB_MANAGEMENT
   WHERE priorityLevel = 2
      AND isScheduled = false
      AND commandGroupId NOT IN (
         SELECT JOB_MANAGEMENT2.commandGroupId
            FROM JOB_MANAGEMENT JOB_MANAGEMENT2
            WHERE JOB_MANAGEMENT2.isScheduled = true
               AND JOB_MANAGEMENT2.executionMode = 'S')
   ORDER BY id ASC
   LIMIT 1
   FOR UPDATE
This query is fast when run alone, but when it runs in parallel with 40 other same queries it is a major bottleneck needing about 40 seconds for each one to complete. the "for update" clause it contains causes the query to block on all other "for update" queries. So when 40 parallel connections send many "for update" queries one after the other, it makes sense for the query to need about 40s to complete.
Extra tests
In the process of developing the main test we investigated some of the performance issues that came up by conducting some more specific different tests.
5000 job ramp-up with and without index on extra_attribute table
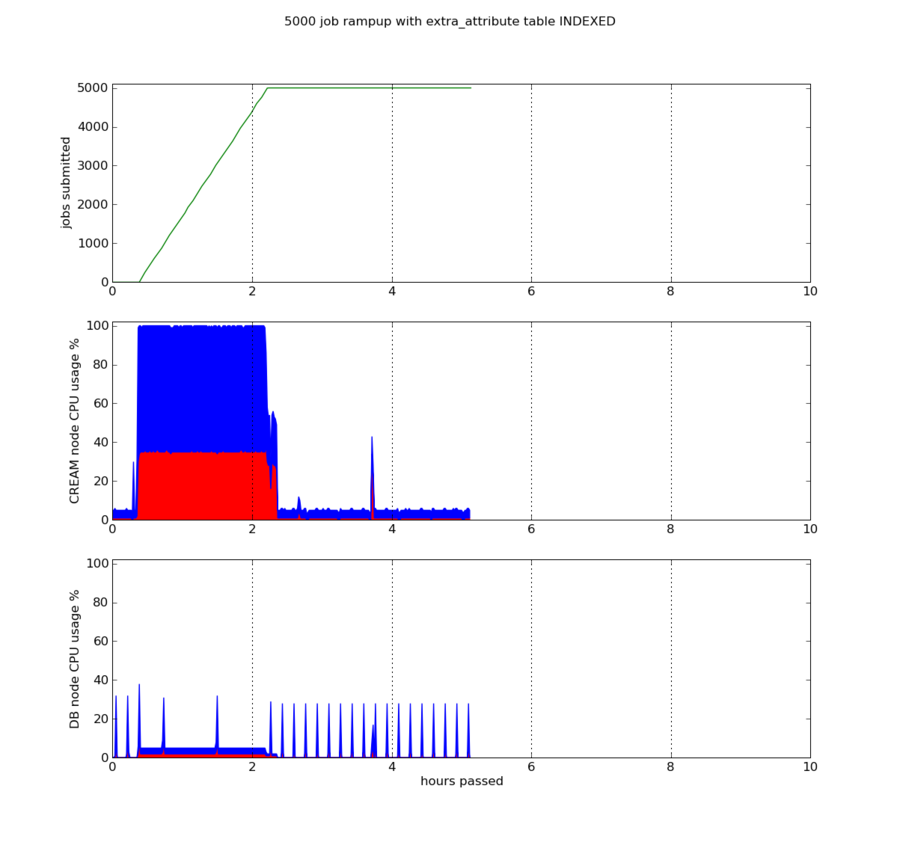
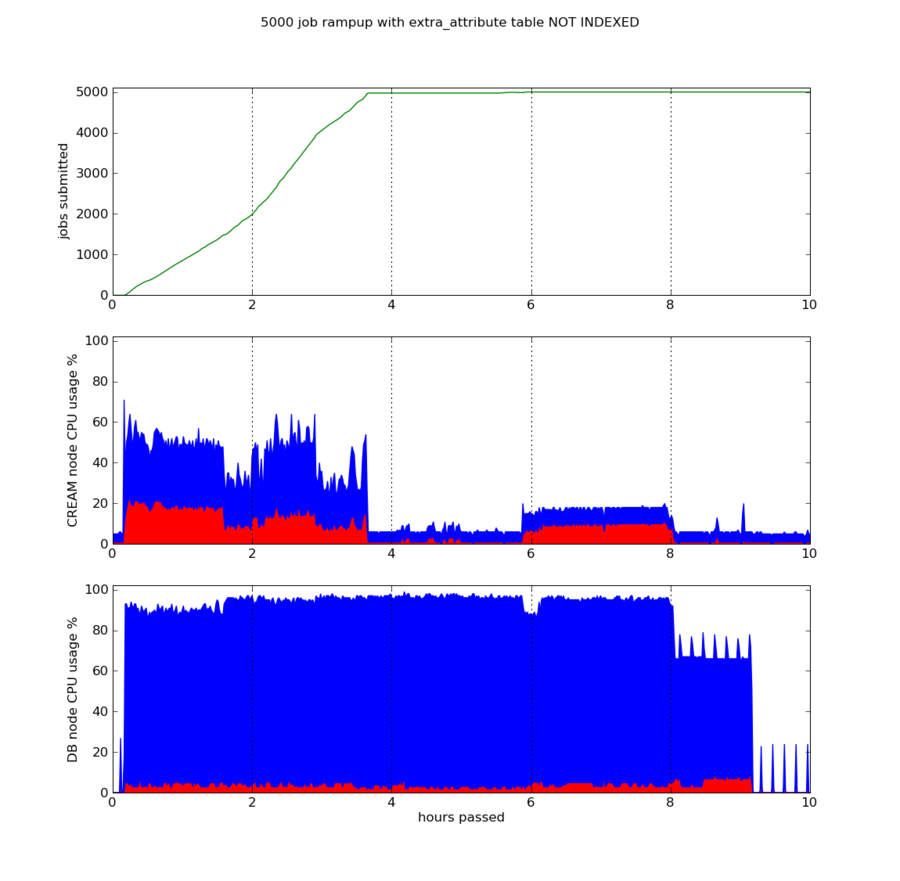
A major change in the default configuration of CREAM for the main test scenario is that the extra_attribute table is indexed on jobId field. This decision was taken because the optimization of the extra_attribute table made certain operations very unreliable. To illustrate the performance gain we carried out the simple ramp-up test that follows, where we measure the stress of CREAM and mysql node with and without the index.
The scenario is that we run 5 parallel glite-ce-job-submit processes from one UI, each one submitting 1000 jobs as fast as it can for a total of 5000 submitted jobs. Jobs are short-lived (60 seconds) and because our cluster is configured as having 500 job slots, they finish at a fast rate leaving the queue almost empty. It also has to be noted that during these tests the CREAM database is already loaded with a good amount of records, as it would be after some time in production.
The graph in Figure 4, “5000 job ramp-up without index” contains data obtained with the default configuration, which is that the extra_attribute table is not indexed. Some assumptions can easily be made according to this graph:
- CREAM service blocks on mysql.
- Even after job submission has finished and jobs have executed and returned succesfully, the database continues to be heavily loaded for quite some time.
- The total time needed for the testbed to idle is about 9 hours.
But there are other, less visible things we should note:
- While more and more jobs are being submitted and the extra_attribute table is growing, the submission rate is diminishing little by little.
- The submission from the UI was finished in about 1.8h. It can be seen on the graph as a drop in CPU usage for CREAM and a slight increase (from 90% to 100%) for mysql. At that point the user had finished submitting 5000 processes from the UI. However most jobs were not submitted to the LRMS and this submission took place asynchronously during the next hours.
-
A very large number of slow queries were being logged by mysql like the following:
UPDATE extra_attribute
      SET value = '/opt/glite/var/cream_sandbox/dteam/...'
   WHERE jobId = 'CREAM782743522'
      AND name = 'DELEGATION_PROXY_CERT_SANDBOX_PATH';

DELETE FROM extra_attribute
   WHERE jobId = 'CREAM016436253';
The delete queries have been found to severely impact operations like purge (not being tested in the period depicted by the graph).
Figure 4. 5000 job ramp-up without index
After the above case was tested the extra_attribute table was indexed with the command
CREATE INDEX extra_attribute_jobId_idx
   ON extra_attribute (jobId(14))
and the test was repeated, yielding results shown in the following graph:
It is obvious that the CE behaviour is more linear and predictable. The CREAM service no longer blocks on mysql and the CPU of the node is fully utilised. The whole test case finished in about 2 hours, about as much time as the job submission needed to complete. After those two hours the CE was idling, until we stopped collecting data at about the 5th hour. The database wasn't heavily loaded at any time and the only visible peaks are slow queries like the one in Example 1, “Current job status query” which occur every 10 minutes.
One can also observe that with or without the index, a big
percentage of the CPU usage on the CREAM node is related to system
calls, probably fork or filesystem
operations.
Purging of approximately 70000 jobs
In this test we execute glite-ce-job-purge
-a on the CREAM service, with a database containing
approximately 70000 unpurged jobs. The test could only be completed
in a reasonable amount of time if the
optimization of the extra_attribute
table was addressed. The results of running the test with the
added index appear in
Figure 6, “CPU usage during purging of approx. 70000
jobs”.
Figure 6. CPU usage during purging of approx. 70000 jobs
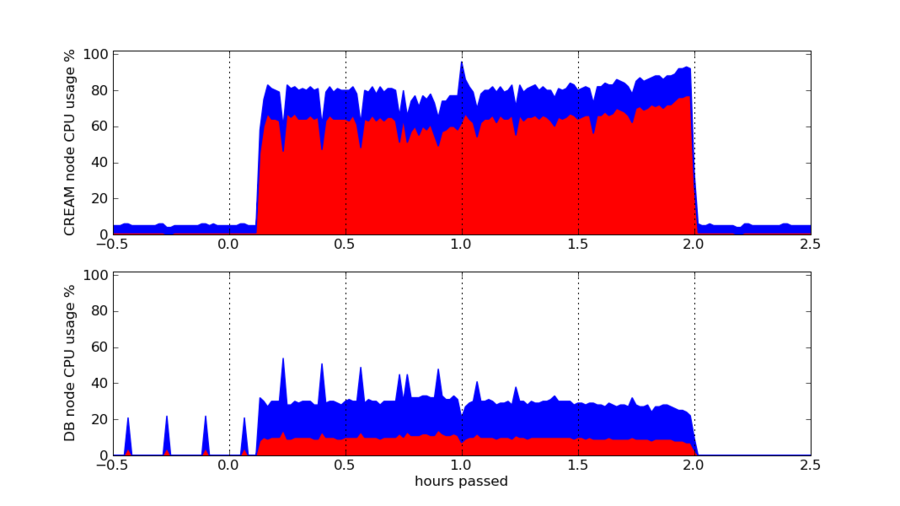
One observation that can be made is that even with the extra_attribute table indexed, purging all jobs still needs about 2 hours to complete. In addition, very interesting is the large percentage of system CPU usage on the CREAM node during the purge. We suspect it is due to recursive filesystem operations, among other things.
Also interesting is the fact that the 10-minute apart spikes observable on the MySQL node before the purge, due to slow queries like in Example 1, “Current job status query”, disappear after the purge. This is, of course, to be expected as the database empties because of the purging.
Issues found to affect performance
Resolved Issues
During the evolution of the main test some previously unknown problems were discovered and reported. In some cases, like the problem with the optimization of the extra_attribute table, these problems were found to have a big impact on the preliminary test results. In addition to reporting these problems we decided to incorporate the corresponding solutions, where applicable, thereby achieving better test results. These fixes are expected to be incorporated in the software distribution and therefore the final results of our tests should be applicable to future production versions.
In the sections that follow we will describe in more detail the specific issues that were resolved before running our tests, along with our proposed fix.
32k subdirectory limit
The Ext3 filesystem has a limit of 32000 subdirectories for each
directory. So when more than 32000 jobs exist in the CE (have been
submitted but have not been purged) and belong to the same user,
the sandbox directory is filled with 32000 subdirectories and all
other job submission attempts produce a FATAL system error in the jobRegister method with the following
message:
cannot write the job wrapper (jobId = CREAM137433664)!
The problem seems to be related to glexec which reported: Broken pipe
This has been reported in bug #43830 and in bug #52050 and has been resolved with patch #2666.
The extra_attribute table in creamdb is not optimised
The extra_attribute table inside the creamdb database is a table designed to accomodate new fields without changing the database schema. At present it is used very frequently for the DELEGATION_PROXY_CERT_SANDBOX_PATH job attribute. The fact that this table was unindexed resulted in slowness for frequently used queries like those used during job submission and job purging. Moreover many other problems arose when the database had a few thousand jobs stored (submitted but not purged) and all this mandated the creation of an index, if we wanted to actually test the complete performance capabilities of CREAM. An index was created with the following command:
CREATE INDEX extra_attribute_jobId_idx
   ON extra_attribute (jobId(14));
This issue was discussed extensively with CREAM developers, it is described in bug #52876 and is fixed with patch #2666.
Too many open files (tomcat)
When the CE is stressed with multiple parallel job submissions,
Tomcat keeps more and more file descriptors open. As a result it
eventually surpasses 1024 open file descriptors which is the
default ulimit and a IOException
occurs, making the CREAM service unreachable. The following trace
is found in glite-ce-cream.log:
1 Jul 2009 21:12:10,787 org.glite...cmdexecutor.AbstractJobExecutor -
      createJobSandboxDir: java.io.IOException: Too many open files
java.io.IOException: java.io.IOException: Too many open files
        at java.lang.UNIXProcess.<init>(UNIXProcess.java:148)
        at java.lang.ProcessImpl.start(ProcessImpl.java:65)
        at java.lang.ProcessBuilder.start(ProcessBuilder.java:451)
        at java.lang.Runtime.exec(Runtime.java:591)
        at java.lang.Runtime.exec(Runtime.java:507)
        at org.glite...cmdexecutor.AbstractJobExecutor.
            createJobSandboxDir(AbstractJobExecutor.java:1065)
        ...
See bug #52651 for more details.
In order to complete the performance test we manually increased the max open files ulimit to a very high number, having sometimes observed more than 8000 open file descriptors concurrently open. So the following line was added in the beginning of /etc/init.d/tomcat5 script.
ulimit -n 32768
While it must be pointed out that addressing the optimization of the extra_attribute table minimized the incidence of this issue, the way that CREAM handled this exception was not ideal, as is described in the section called “Robustness”.
Maui unable to do job reservations due to incorrect reservation depth
Maui was complaining about being unable to do job reservations.
It turned out that the default reservation depth of maui is 24, so
reservations were failing on our 100 CPU SMP nodes (set like that
to emulate 500 job slots in total). To accommodate the needs of
this test plan, particularly the need for simulating the 500 job
slots, we appended the following line in maui.cfg on the LRMS node:
RESDEPTH 200
Torque/PBS configuration problems
-
pbs_server is by default set up to send mails in case of various failures. However these mails are targeted to pool users on the CE. Mails should never be delivered to pool users. Moreover if the LRMS node is different from the CE (our case), the delivery fails and sendmail's mqueue gets filled up with thousands of undeliverable mails. We resolved this issue by running the following command on the LRMS node, as described in bug #52399.
set server mail_domain = never
-
One general observation after stress-testing several times our testbed was that jobs were sometimes stuck inside the LRMS queue, in state queued, forever. A precautionary measure we took to handle this was to enable the mom_job_sync pbs_server feature, after which that behaviour was not reproduced. The command to enable the feature is the following:
qmgr -c "set server mom_job_sync = True"
That option is enabled in the default Torque installation from Torque version 2.2.0 onwards, but it seems that yaim is not enabling it for the version used in gLite. The mom_job_sync option is documented as follows:
specifies that the pbs_server will synchronize its view of the job queue and resource allocation with compute nodes as they come online. If a job exists on a compute node in a pre-execution or corrupt state, it will be automatically cleaned up and purged. (enabled by default in TORQUE 2.2.0 and higher)
--TORQUE Admin Manual
glexec issues
In past executions of this performance test we were facing a large number of job failures, getting glexec related error messages like the following:
glexec[5845]: Failed to obtain a lock (with flock) on proxy
   /opt/glite/var/cream/user_proxy/.../authN.proxy:
   Resource temporarily unavailable
We were facing this problem especially during multiple parallel job submissions. As it turned out, when an instance of glexec tried simultaneously to get a lock on an already locked file, it returned with error instead of waiting for the lock to unlock, as reported in bug #51885. Additionally another glexec failure due to a race condition was revealed during multiple parallel job submissions. All necessary fixes are incorporated into patch #2973.
Open Issues
The high cost of job proxy renewal
Currently in CREAM, when a proxy with a specific delegation ID
is renewed (glite-ce-proxy-renew) the
proxy under /opt/glite/var/cream/user_proxies is renewed
along with the proxies for each job submitted using the same
delegation ID: CREAM calls the blah_job_proxy_renew operation for
each job which updates (via glexec) the proxy on job sandbox dir.
This is not very efficient, as can be seen from the spikes in
Figure 2,
“Queued jobs and CREAM CPU usage”. The problem is also
described in bug
#51993.
User commands often timeout
An issue that resulted from the occasional slow performance of
CREAM is related to the usability of the glite-ce-* family of commands. Specifically, when
CREAM is under stress and is slow to respond, what the user sees
from the UI when utilising glite-ce-* commands does not reflect
what really happens on the CREAM CE. It is very common for the user
to get SOCKET TIMEOUT errors on the UI when interacting with a
heavily loaded CE, and to assume that his command has failed,
however most times the CE continues processing his request.
The expected interaction from user's perspective would be that when his command fails then that means the operation is no longer executing on the CE. That means that when the socket connection gets closed for any reason (e.g. socket timeout) the CE should detect that and act accordingly, i.e. cancel the operation.
On the other hand the socket shouldn't timeout that easily when
CREAM is simply waiting for the database. An (HTTP?) keep-alive
message should be periodically sent from the CE to the UI to make
it evident that it is still processing the request. It makes sense
for a user that requests the status of all jobs (glite-ce-job-status -a) to wait 2-3 minutes. A
manual cancelation of the request on the UI (with Ctrl-C for
example) should terminate the operation on the CE too.
Proxy delegation slowness
In general proxy delegation can be classified as a CPU heavy operation which should be avoided. Job submission rates drop significantly if auto-delegation is used and the CE node utilises much more CPU. In cases where CREAM is heavily loaded a user issuing proxy delegations from a UI may experience SOCKET TIMEOUT errors on a regular basis.
High system CPU usage on CREAM
An additional observation is that a large percentage of CREAM's
CPU usage is system time,
not user. This can mostly be attributed to the chosen job
submission architecture which mandates the use of many
fork()/exec() calls for spawning commands like blahpd, grid-proxy-init, pbs-submit.sh etc, repeated for each job
submission.
CREAM startup lag
Sometimes when restarting the CREAM service with the command
service tomcat5 restart, the service
is unavailable for several minutes. It seems that it is querying
the database for all stored jobs. Even though the situation is
ameliorated with the indexing of the extra_attribute table, the time needed is
sometimes still more than 5 minutes. This is misleading because an
admin usually restarts the service due to malfunctions, but testing
it right after the restart makes him think the problem is not
fixed.
Rare BLParserPBS data corruption
In rare cases, and only when the CE was receiving many parallel job submissions for a long time, the following java exception occured, and was logged in catalina.out file:
java.text.ParseException: Unparseable date: "2009-06-16 15:1[BatchJobId="21520"
        at java.text.DateFormat.parse(DateFormat.java:335)
        at org.glite.ce.cream.jobmanagement.cmdexecutor.blah.LRMSEventsProcessor.processEvent(LRMSEventsProcessor.java:74)
        at org.glite.ce.cream.jobmanagement.cmdexecutor.blah.BLParserClient.readDataFromSocket(BLParserClient.java:265)
        at org.glite.ce.cream.jobmanagement.cmdexecutor.blah.BLParserClient.run(BLParserClient.java:303)
It seems that BLParserPBS was sending corrupted data to CREAM due to a thread contention issue. See bug #51892 for more information.
Robustness
While our tests were not especially designed to validate the robustness and failure recovery capabilities of CREAM, during our tests we did make some related observations mostly due to the exceptional conditions that arose. While not directly related to the criterion for 5000 sustained queued jobs, these observations are related to the other acceptance criteria for the transition to CREAM.
Recovery from errors. Our first observation was made when we encountered a problem with tomcat file descriptors. When the max open file descriptor ulimit was surpassed, CREAM did not handle the exception that occured gracefully. The service remained unavailable even when most file descriptors were closed, until the administrator manually issued a restart.
Robustness against high load. While CREAM itself has been found to be robust even under heavy load, it would be useful if CREAM could deny service to users with a nice error instead of socket timeout errors after several seconds on their commands. There is also a bug (#48786) about this requirement, discovered during previous certification efforts.
Robustness against LRMS failure. Another limit that could be usefully imposed would be in the case where the load of the LRMS node is extremely high, in which case CREAM should pause the submission of jobs until the load on the LRMS node will come down to acceptable levels. For example, sometimes during our tests, when the queue size reached about 10000 queued jobs , the maui scheduler (which seems to be very memory hungry) on the LRMS node grew so much in size that the whole LRMS node was practically halted due to swapping. CREAM, which proved to be more robust, kept registering new jobs even though it couldn't submit them to Torque at the same rate. This exacerbated the situation by growing the queue even more and causing more swapping for the TORQUE_server node. Unavoidably this led to an increase in the CE load as well, to the point that user commands started timing out.
Robustness during reboot. Between successive invocations of our test we rebooted the CREAM machine while it was handling many jobs in the queue. We didn't notice any important problems with lost or aborted jobs.
Conclusion
As we can see in the test results, the CREAM service can fulfill the 5000 job requirement. In particular we have found that using the particular software component versions, deployment and configuration of the main test, CREAM is capable of handling more than 5000 jobs sustained in its queue.
Having said that we must note that at the time of this writing the software components and the deployment methods and configurations used in the main test are significantly improved from what is currently available for use in production. Judging from our experience in running the tests and from the number of performance issues that were raised during this process it is unsafe at best to say that CREAM can fulfill the 5000 job requirement under the circumstances that are now the default.
In any case the performance of CREAM is very much dependent on the performance of the database. While the efficiency of database operations has been improved, for example with the optimization of the extra_attribute table, it is possible that more optimisation is possible and can have an important effect. Database normalization combined with reformulation of queries is one idea that might be pursued.
Acceptance criteria coverage and results
In order to start the transition from the LCG-CE to the new CREAM service a set of acceptance criteria have been specified. Six of these criteria have been assigned to SA3, in order to investigate whether they are satisfied. The tests described in this document provide coverage for some of these criteria, as can be seen in Table 4, “CREAM Transition Acceptance Criteria Coverage”.
Table 4. CREAM Transition Acceptance Criteria Coverage
| Criterion | Coverage | Result | |
|---|---|---|---|
| D.ii | The ICE-WMS must deal gracefully with large peaks in the rate of jobs submitted to it. | Not covered | N/A |
| J | At least 5000 simultaneous jobs per CE node | Covered | Satisfied |
| K | Unlimited number of user/role/submission node combinations from many VO's (at least 50) | Not covered | N/A |
| L | Job failure rates in normal operations due to the CE < 0.1% | Covered | Satisfied |
| M | Job failures due to restart of CE services or reboot < 0.1% | Partially covered | No job failures noticed during reboot |
| O | Graceful failure or self-limiting behavior when the CE load reaches its maximum | Partially covered | Room for improvement re. self-limiting behavior. |
Acknowledgements
Many thanks to the CREAM team at INFN, for the invaluable feedback they provided about CREAM internals and their help with various problems we encountered.
References
Design and implementation of the gLite CREAM job management service. INFN Technical Note. INFN/TC_09/3. May 5, 2009.
CREAM home page. http://grid.pd.infn.it/cream/.
Torque and maui reference documentation. http://www.clusterresources.com/resources/documentation.php .
A. Installed patches
The following patches were applied upon the production versions of the software components:
Table A.1. Patches applied per component
| Node | Patch | Description | Status at the time of the test |
|---|---|---|---|
| CREAM | 2973 | gLExec, LCAS, LCMAPS introduction on WN and update for CREAM | Certified |
| 3042 | YAIM-CREAM-CE 5th update | Certified | |
| 2782 | New version of glite-info-provider-service for the CREAM CE | Certified | |
| 2990 | LCMAPS update fixing the poolindex bug (patch #2973 depends on this) | Certified | |
| 2635 | LCAS/LCMAPS update for lcmaps plugins verify-proxy and basics (renewed) (patch #2973 depends on this) | In PreProduction | |
| PBS_server/maui | 2704 | R3.1/SLC4/i386 New Torque and Maui Patches. | In PreProduction |
| 2707 | [ yaim-torque ] YAIM release for torque server, client and utils | In PreProduction |
B. 60-minute JDL
   JobType     = "Normal";
   Executable  = "/bin/sleep";
   Arguments   = "3600";
   StdOutput   = "env.out";
   StdError    = "env.err";
C. Useful SQL queries
Job status count query.
SELECT name AS status,count(name) AS count
                   FROM job_status AS status
                      LEFT JOIN job_status_type_description AS d
                         ON status.type=d.type
                      LEFT OUTER JOIN job_status AS latest
                         ON latest.jobId=status.jobId
                            AND status.id < latest.id
                   WHERE latest.id is null
                   GROUP BY status.type;
The data for Table 3, “Job status'” was obtained with the above query against creamdb.
Job failure reason query.
   SELECT s.failureReason AS error,
          count(s.failureReason) AS times
      FROM job_status AS s
         LEFT JOIN job_status_type_description AS d
            ON s.type=d.type
         LEFT OUTER JOIN job_status AS latest
            ON latest.jobId=s.jobId
               AND s.id < latest.id
      WHERE latest.id IS null
         AND d.name="DONE_FAILED"
      GROUP BY s.failureReason;
The query above selects the failureReason for the jobs in a specific state, e.g. DONE_FAILED in the example above.
D. Monitoring scripts
CREAM monitoring script.
#!/bin/sh

   TIME=`date -Iminutes`
   LA=`sed -e 's/^\([^ ]*\).*\/\([^ ]*\).*/\1 \2/' /proc/loadavg`

   TOMCAT=`ps --no-headers -C java -o %cpu,size    |
       awk 'BEGIN{cpu=0;sz=0}{cpu+=$1;sz+=$2}END{print cpu" "sz}'`
   BLAHPD=`ps --no-headers -C blahpd -o %cpu,size  |
      awk 'BEGIN{cpu=0;max=0;sz=0;count=0;}
         {count+=1; cpu+=$1; if ($2 > max) max = $2 ; sz+=$2;}
         END{print cpu" "max" "sz/count" "count}'`

   echo -e "$TIME\t$LA\t$TOMCAT\t$BLAHPD"
The script is run via cron
PBS monitoring script.
#!/bin/bash

   VO=${1:-dteam}

   TIME=`date -Iminutes`
   LA=`sed -e 's/^\([^ ]*\).*\/\([^ ]*\).*/\1 \2/' /proc/loadavg`

   PBS_SERVER=`ps --no-headers -C pbs_server  -o %cpu,size  |
       awk 'BEGIN{cpu=0;sz=0}{cpu+=$1;sz+=$2}END{print cpu" "sz}'`
   MAUI=`ps --no-headers -C maui        -o %cpu,size  |
       awk 'BEGIN{cpu=0;sz=0}{cpu+=$1;sz+=$2}END{print cpu" "sz}'`
   BLPARSER=`ps --no-headers -C BLParserPBS -o %cpu,size  |
       awk 'BEGIN{cpu=0;sz=0}{cpu+=$1;sz+=$2}END{print cpu" "sz}'`

   PBSSERV_FD=`ls /proc/\`/sbin/pidof pbs_server\`/fd|wc -l`
   MAUI_FD=`ls /proc/\`/sbin/pidof maui\`/fd|wc -l`

   JOBS=`qstat $VO |awk 'BEGIN {r=0;o=0}
    /[EHQRTW] '"$VO"'/{if ($5 == "R") r++ ;if ($5 ~ /[EHQTW]/) o++}
    END {print r" "o}'`
   COMPLETED=`showstats  -g $VO|grep "^$VO"|awk '{print $5}'`
   [ $? -eq 0 ] || COMPLETED="0"

   echo -e "$TIME\t$LA\t$BLPARSER\t$MAUI\t$MAUI_FD\t$PBS_SERVER\t"\
   "$PBSSERV_FD\t$JOBS\t$COMPLETED"
The script is run via cron.
MySQL monitoring script.
#!/bin/sh

   TIME=`date -Iminutes`
   LA=`sed -e 's/^\([^ ]*\).*\/\([^ ]*\).*/\1 \2/' /proc/loadavg`

   MYSQLD=`ps --no-headers -C mysqld -o %cpu,size  |
       awk 'BEGIN{cpu=0;sz=0}{cpu+=$1;sz+=$2}END{print cpu" "sz}'`

   echo -e "$TIME\t$LA\t$MYSQLD"
The script is run via cron.
Colophon
Written in Docbook 5.0. Transformed to HTML with Docbook XSL-NS stylesheets and HTML-Tidy. Transformed into PDF with FOP and fop-pdf-images. Graphs produced using python matplotlib.
[1] the submission rate that results for all processes together is about 90 jobs per minute
[2] this depends on whether the queue was stopped during the initial phase or whether jobs were permitted to run, which would result in fewer jobs in the queue
[3] see the section called “the issue with proxy renewal” for more information.
